The console
The console is the primary interface to Lumen. It shows what the collectors captured, what the policy did about it, and which machines are reporting, and it is where policies are written and endpoints are enrolled. It is not open to the public internet. Access is arranged with Wazuh, and the address comes with it rather than from this documentation.
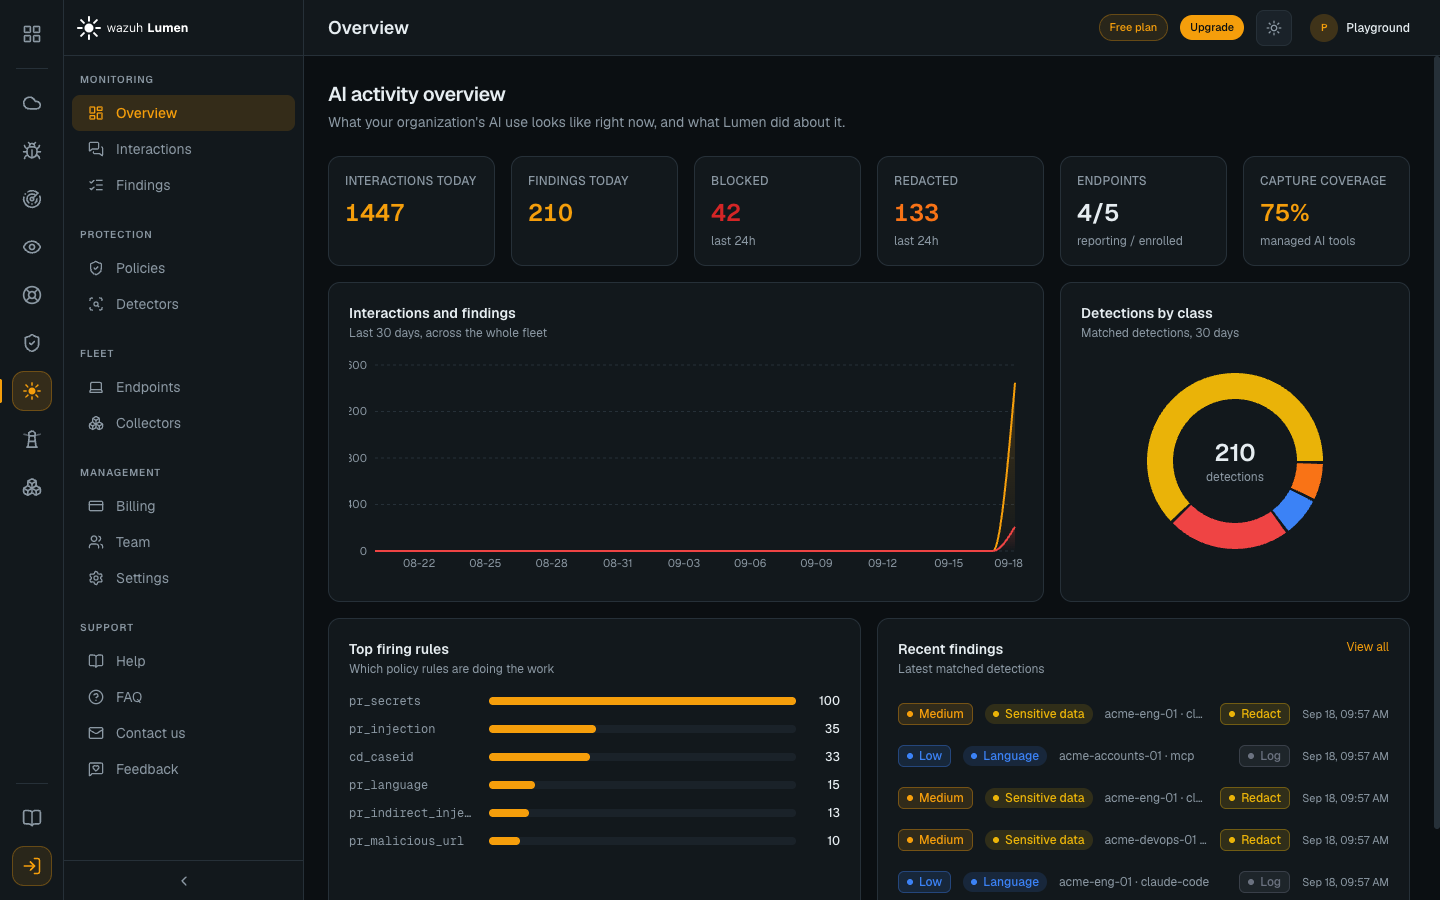
What each area shows
The navigation is grouped in five sections.
| Group | Area | What it shows |
|---|---|---|
| Monitoring | Overview | Six figures. Counts for the current UTC day, which reset at 00:00 UTC, of interactions, findings, blocked and redacted (each with how many more the policy would have blocked or redacted where the verdict was held at a lower action: by the endpoint's Monitoring mode, by provenance, because text from earlier turns of a conversation is inspected but never enforced, or by a browser that received the verdict after the prompt had already been sent (A block the browser did not apply). A fully Enforcing fleet can therefore still show a would-have count), then the endpoints reporting out of those enrolled and the capture coverage percentage. Below them a trend, a breakdown by detection class and the rules that matched most. Each figure links through to the records behind it, with the filter already applied |
| Monitoring | Interactions | Every inspected interaction, filterable and searchable. See Interactions and findings |
| Monitoring | Findings | Only the interactions that matched something, filterable by severity. See Interactions and findings |
| Protection | Policies | The policies in the organization and the rules inside them. See Policies |
| Protection | Detectors | The detection classes, whether each is live or conditional, and how many matches each produced. See Policies |
| Fleet | Endpoints | Every enrolled machine, its agent version, its policy and its capture coverage. See Endpoints |
| Fleet | Collectors | The collector families and which of them exist today |
| Management | Billing | The organization's plan, its payment method, its usage, and the workspace against the daily service limits. See Plans and pricing for what each plan costs and includes, and Service limits for the limits |
| Management | Team | The members of the workspace, the invitations waiting to be accepted, and their roles. See Team and roles |
| Management | Settings | Your own console preferences, such as the theme. The organization itself is administered in the Wazuh Hub, and the link there is on this page |
| Support | Help, FAQ, Contact us, Feedback | In-product help and the routes back to Wazuh |
An interaction is not a finding
Every inspection the agent performs produces an interaction record, whether anything matched or not. Interactions holds every record, and Findings holds every record where at least one detection matched.
What Lumen counts as a finding (Findings today, Billing, Service limits) differs from the Findings list in two ways. It is narrower: a match on text already reported earlier in the conversation, or in an earlier turn, is recorded but counted as agent activity, and the Findings list hides those with Hide repeats. It is also wider: a Block or Redact, or a would have blocked or would have redacted, that no detection explains (an access rule, or a policy whose default action blocks) is counted as a finding but matched nothing, so it is on Interactions, with the action it took, and not on the Findings list. Either way, the count of findings is never larger than the count of interactions.
The day-scoped figures on Overview count what the endpoints saw, not only what was stored:
- Interactions today counts every event, including events kept without their text and clean copies the agent recognised as duplicates and did not upload.
- Findings today counts every finding as defined above, including findings counted past a capacity ceiling and findings the agent had to drop from its own disk queue and reported.
The figures reset at 00:00 UTC, the same day the allowances and the billing use, and the 30-day trend counts each day the same way. See Service limits.
Severity: what the policy wanted, and what was found
The agent's record has no severity field, so the console derives severity from the record, and the Findings severity filter uses exactly the same formula, so a badge and the filter always agree. A finding's severity is the higher of two things.
What the policy wanted to do. This is the action the rule asked for, even when monitor mode held it down to Log:
| Action the policy wanted | Score | Severity |
|---|---|---|
| Block | 0.9 and above | Critical |
| Block | below 0.9 | High |
| Redact | any | Medium |
| Log | any | Low |
What was found. Some classes are serious whatever the action:
| Detection | Severity at least |
|---|---|
| Prompt injection scoring 0.80 or more | High |
| Sensitive data scoring 0.50 or more | High |
| Malicious entity scoring 0.90 or more | Medium |
| Toxic content, topic, language, custom definitions | Low |
So a prompt injection that a Log rule, or a monitored endpoint, only recorded still reads High, and a blocked one scoring 0.9 or more reads Critical. A detection below its class's default threshold does not raise severity, because detectors also report weak signals. An interaction with nothing matched is not a finding. See From monitor to enforce.
Shadow
A finding marked Shadow is one where a prompt rule wanted to Redact or Block and an access rule capped the outcome at Log. The badge reports what would have happened under the prompt rule alone, so it reads as a preview of a stricter posture rather than as something that was enforced. Nothing was blocked or redacted on a Shadow finding.
Capture coverage
Each endpoint reports the AI tooling the agent discovered on it and what state each target is in.
| State | Meaning |
|---|---|
| Managed | The target was found and its traffic is routed through the agent |
| Found | The target is installed and is not routed, so its traffic is not inspected |
| Conflict | The target is routed somewhere other than the agent, which the agent will not silently overwrite |
The figure on the Overview page and the one on each endpoint are the same measure, expressed as managed out of found.
The discovery describes the account the agent runs as. The targets it looks for are per-user, such as a shell profile or an editor's settings inside a home directory, and a packaged install runs the agent as a service account rather than as the people using the machine. Targets belonging to real users are therefore reported as not installed. Treat a low coverage figure as a prompt to check the machine rather than as a count of unprotected tooling.