Endpoints
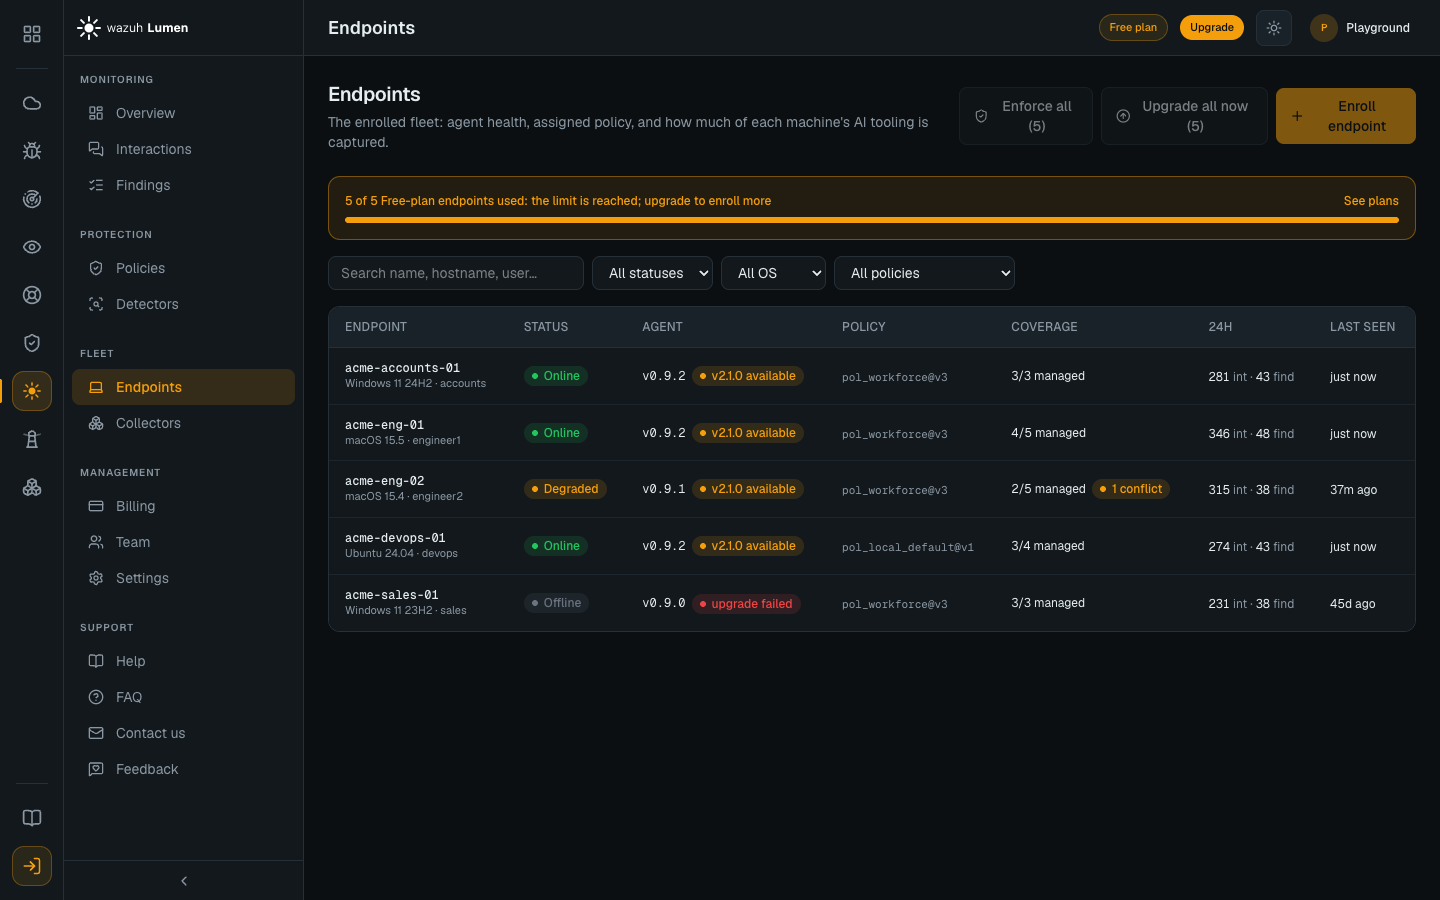
The Endpoints area lists every machine that has enrolled, with the agent version it reports, the policy assigned to it, its capture coverage and the AI tools found running on it. It is where machines are added and removed, and it holds the switch that decides whether the fleet acts on its policy or only watches. Three of its other controls do something narrower than their labels suggest, and this page is mostly about those.
Enrolling a machine
The enroll wizard mints a single-use token and prints the install command that carries it. The command is run on the target machine, and the wizard waits for that machine to report in.
After three minutes without a report the wizard says that nothing has arrived
yet. It keeps listening, so a late arrival still lands on the success screen.
The two causes it names are the common ones. The token was already used or has
expired, or the machine has no HTTPS egress to the control plane. Running
lumen-agent status on the machine names the reason directly, and the installer
prints whether it finished connected.
An enrollment can also be refused because the organization is at its endpoint allowance. That check happens when the agent enrolls, not when the wizard hands over the command, so a wizard that has already printed an install command is not a promise that the enrollment will be accepted. The token is not consumed by such a refusal, so the same command works once there is room. See Plans and pricing for the allowance each plan carries.
The AI agents on a machine
Each endpoint's detail panel lists the AI agents the sensor has found on that host: coding agents and AI tools such as Claude Code, Cursor, Zed or Ollama, the Claude Desktop and ChatGPT Desktop apps, and the AI sites its browser opened. This is discovery, not inspection. It tells you that a tool is present or in use on the machine, never what anybody typed into it. What was actually sent to a model lives in Interactions; this is the separate question of which AI tools exist on the fleet at all, including ones nobody told you about.
Each row shows the tool, where its binary lives when it is a program, and one of these states:
| State | Meaning |
|---|---|
| Running | A live process was seen at the machine's last check-in |
| Dormant | The tool is installed, or was seen before, and is not running now; it is kept, with the time it was last seen, until it has been gone long enough to drop off |
| Seen in browser | An AI site was opened in the machine's browser, where the browser collector is installed: ChatGPT, Claude, Perplexity and Gemini, which it also captures, and Microsoft Copilot and the other AI sites it only recognises. A name only, never the page or what was typed. A site is never "running" or "dormant" |
| MCP server | An MCP server configured for Claude Code or Claude Desktop on the machine, by name only, never its command or settings. Reported by the per-user inventory job (macOS and Linux). On Windows it appears only after lumen-agent inventory is run as the user |
Claude Desktop and the Claude Code engine its Code tab runs are two rows: the app is Claude Desktop, and a Code session also shows Claude Code. The desktop apps are named apart from the web tools on purpose, so Claude Desktop and Claude (the site, seen in the browser) never fold into one row.
Every row also carries when the tool was first seen and last seen, so the list is a picture of AI use on the machine as it changes over time rather than a single snapshot. It refreshes on each check-in, not in real time.
AI inventory in the Fleet menu is the same information rolled up across every machine: each AI tool with how many machines run it, how many carry it dormant, how many opened it in the browser, and a drill-in to the exact machines. MCP servers are listed apart, with the machines they are configured on; they are tooling, not AI tools, so they are not in the tool counts. It is the fastest way to answer "how much of the fleet is running this tool" and to spot AI that has appeared on machines without being rolled out.
A note on who is named. The inventory always identifies the machine by its hostname. It names the person running a tool only where an administrator has turned that on for the tenant; left off, the machine is shown and the individual is not.
Volume today
The list's Today column counts the events each endpoint has seen since 00:00 UTC, whether their text was stored or not. The detail panel adds Events today and Stored without text today, the second being the clean events kept as rows without their text because the endpoint was past its daily allowance.
Two labels flag an endpoint's volume, on the list and in the detail panel:
| Label | Meaning |
|---|---|
| Text limited | At least once today the endpoint had used its own allowance and had nothing left to borrow, so some of its clean events were stored without their text. Its findings are not affected |
| Unusual volume | The endpoint reached a capacity ceiling, used its allowance far faster than a person-driven agent does, or stored an unusually large number of events without text. This can be a very busy agent, or another program on the machine calling the agent's local API |
Neither label pauses, suspends or charges anything, and the endpoint keeps inspecting and reporting. If the volume is not legitimate, remove the endpoint (below). The allowances and ceilings are in Service limits, and the Billing page shows the whole workspace against them.
Monitoring and Enforcing
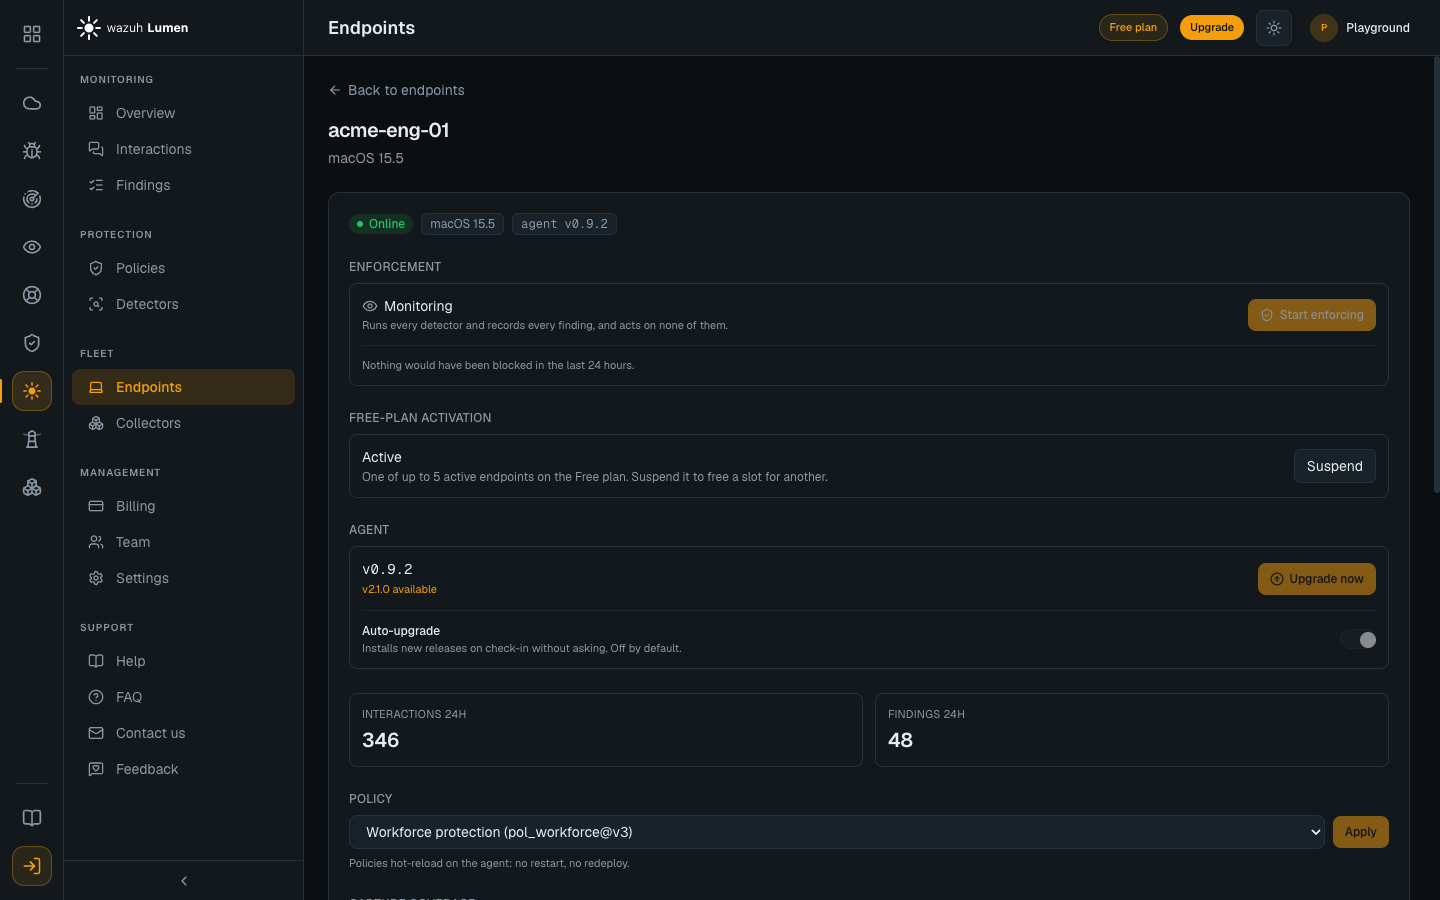
Every endpoint carries an enforcement mode of its own, shown in its detail panel and owned by the console. It is the answer to a question the policy does not ask: whether this machine is allowed to act on the policy it holds.
| Mode | What the endpoint does |
|---|---|
| Monitoring | Runs every detector its policy references and records every finding, and acts on none of them: every verdict is capped at Log and recorded with action.mode: "monitor", in the agent's proxy, the Claude Code hook guard, the MCP wrapper and the browser extension alike (on agents up to v2.10.0, see the note below) |
| Enforcing | Redacts and blocks as the assigned policy says. On Local default, whose every rule logs, that is nothing |
A newly enrolled endpoint is in Monitoring, and stays there until somebody changes it. Nothing on a machine in Monitoring is redacted or blocked, however its policy is written. This is deliberate, because the first hours of a deployment are when a rule is most likely to stop work it should not have stopped, but it also means that assigning a policy full of Block rules to a new machine changes nothing on its own. A new endpoint is also assigned Local default, which only logs, so it is held at Log twice over: acting takes a policy with promoted rules and Enforcing. See From monitor to enforce.
On an agent at v2.10.0 or earlier the switch reaches the agent's own daemon only: its capturing proxy and its inspection API. The Claude Code hook guard, the MCP wrapper, the browser extension's native-messaging host and a standalone lumen-agent proxy run their own copy of the engine and do not read the switch there, so on a Monitoring endpoint they still redact and block as the policy says, and their findings record action.mode: "enforce". The endpoint's page says so for an endpoint reporting one of those versions. Upgrade the agent to hold them at Log too. On Local default they only log either way, because they run the same policy.
The detail panel also marks a rule that cannot fire on that machine: with no
threat-intel snapshot on the endpoint (none ships), pr_malicious_url is shown
as inactive, because its detector is not registered without one. It is also left
out of the count of rules that act, so a policy whose only Block is
pr_malicious_url is labelled as changing nothing on that machine, even at
Enforcing. The endpoint reports this on its heartbeat; an agent too old to
report it shows nothing, and its rule is counted as written.
Switch to monitor applies straight away. Start enforcing asks for confirmation first, because it is the direction that can interrupt somebody's work. Enforce all does the same for every endpoint still monitoring, and reports how many changed.
Enforce with the recommended policy
On an endpoint whose policy only logs, which is every endpoint still on Local default, the enforcement panel also offers Enforce with the recommended policy, and so does the confirmation Start enforcing opens there. It is two changes in one step, and its confirmation names both before anything happens: it assigns the built-in Recommended enforcing policy in place of the one the endpoint holds, and it switches the endpoint to Enforcing, so the machine starts blocking prompt injection and redacting secrets and case ids on live traffic. A rule that cannot fire on that machine, such as the malicious-link rule without a threat-intel snapshot, is named there too. Confirmed, both changes reach the machine at its next check-in. If the policy is assigned but the switch fails, the panel says so and the endpoint stays at Monitoring; Start enforcing finishes it. See Policies for what the policy contains.
Like the other controls here it is shown to admins only, and it is not offered on an endpoint whose policy can already act: there, Start enforcing is the whole decision.
Either way the change is a request, not an instant. Each machine picks it up on its next check-in, and the fleet list shows the mode each endpoint has reported rather than the one that was asked for.
The switch never promotes a rule. Enforcement only lifts the cap. An endpoint whose policy is all Log, which is every endpoint on Local default, behaves identically in both modes, and the console labels that case rather than letting it read as protection. Changing what a rule does is done in Policies.
On the machine, lumen-agent status and lumen-agent policy effective ask the
running daemon for the endpoint's mode and fold it in: a policy with promoted
rules held at Monitoring prints MONITOR (console ceiling); the policy would: ...
rather than ENFORCING, and a policy that only logs prints the same at either
mode. With the daemon down, policy effective says the mode is unknown. See
Reading findings on the endpoint. The agent's log
records the mode when it changes.
An endpoint in Monitoring reports how many interactions in the last 24 hours its policy wanted to block and did not. That count is the measured cost of the decision, and it is the number worth reading before making it. Where the policy holds no rule that can act, the console says so instead of reporting a zero, because a zero there means no rule was ever going to fire rather than nothing dangerous happened.
Upgrading the agent
Upgrade now does not upgrade now. It pins the endpoint to the current release, and the pin travels to the machine on its next check-in. A machine that is offline takes it when it returns. Once the device reports the pinned version the pin has done its job and clears itself.
Upgrade all now applies the same pin to every endpoint that is active and behind the current release, in one call. The confirmation reports how many were queued, which is a count of pins written and not a count of machines upgraded.
On the machine the agent replaces its own binary and the service manager restarts it. The binary it replaced is kept beside the new one, so a failed upgrade can be rolled back. See Agent lifecycle.
Auto-upgrade is standing consent
Auto-upgrade is off by default, and turning it on for an endpoint is a consequential decision rather than a convenience setting. With it on, every new release installs itself on that machine at its next check-in, with no further approval and no notification first. The agent runs as a service, so this is unattended replacement of a privileged binary on a managed machine.
Left off, an endpoint moves only when somebody uses Upgrade now or Upgrade all now.
Removing an endpoint
Remove endpoint revokes the device's credential. The machine is refused at its next check-in, it disappears from the fleet list, and the enrollment slot it held is freed for another machine.
Two things it deliberately does not do:
- It does not delete the history. Every interaction that endpoint already recorded stays, and stays searchable. Removing a machine's records is a separate matter governed by the retention window. See What Lumen stores.
- It does not uninstall the agent. The agent on that machine keeps running. It stops being accepted by the control plane and its status reports the refusal, but nothing has been removed from the machine. Uninstalling is done on the machine itself, and that is what also un-routes the AI tooling the agent had been capturing. See Agent lifecycle.